
I’ve got a really exciting announcement to make today. Well, you might know it, it’s probably in the title… xG stats.
We have added xG stats to the football software!
Adam, our head software developer, has just dropped yet another update to the football software.
XG stands for ‘Expected Goals’ and it’s a statistic that is calculated by working out during a football match.
How likely a team would be to score a goal based on how they’re performing.
The calculation then gives you a figure of how many goals each team should have scored based on their play.
Now, obviously, the full time score is not necessarily going to reflect the same figure. It’s a guide that gives an indication what the actual score should have been, if luck wasn’t involved.
xG stats are a calculation, using stats like possession, shots and quality of chances created etc.
XG is a stat that a lot of people like because I think as traders, we like to know, well, how should the result have been? Because then we can start to formulate a conclusion as to how the match went.
You know, let’s say we watch Liverpool vs Man United. Liverpool are at home and they absolutely dominate the play. They have 20 shots, should have scored loads of goals but the game finishes 0-0.
Well, if you just look at that score line, you will get a picture of, well, this was obviously a bit of a dull game, no goals. Probably an even match between the two teams, probably two solidly defensive teams.
But then if you look at the XG and it says Liverpool’s xG was 3.42 so they should have had 3.42 goals and Man United’s XG was 0.17 so the score should have been 3-0 to Liverpool.
So we know Liverpool dominated the game and luck didn’t go in their favour in this instance.
But this stat is suggesting that Liverpool were the dominant team and this would be a powerful statistic to take into the next match.
Now, how are xG stats actually calculated by us?
So basically what we do is we look at the average XG over the last few matches.
You cannot know the stat of XG for a match until the match is concluded.
So if you were to get an average, you might go well, ok, the teams had an average of 2.17 XG in the last 10 games.
So therefore, I think that in this match they should be expected to score 2.17 goals.
Now, that’s a conclusion you could draw.
That’s a hypothesis that you could work to and test as a strategy.
But it’s not something that I could say just because this has a 2.17 average, that means that in the next match there will be 2.17 goals.
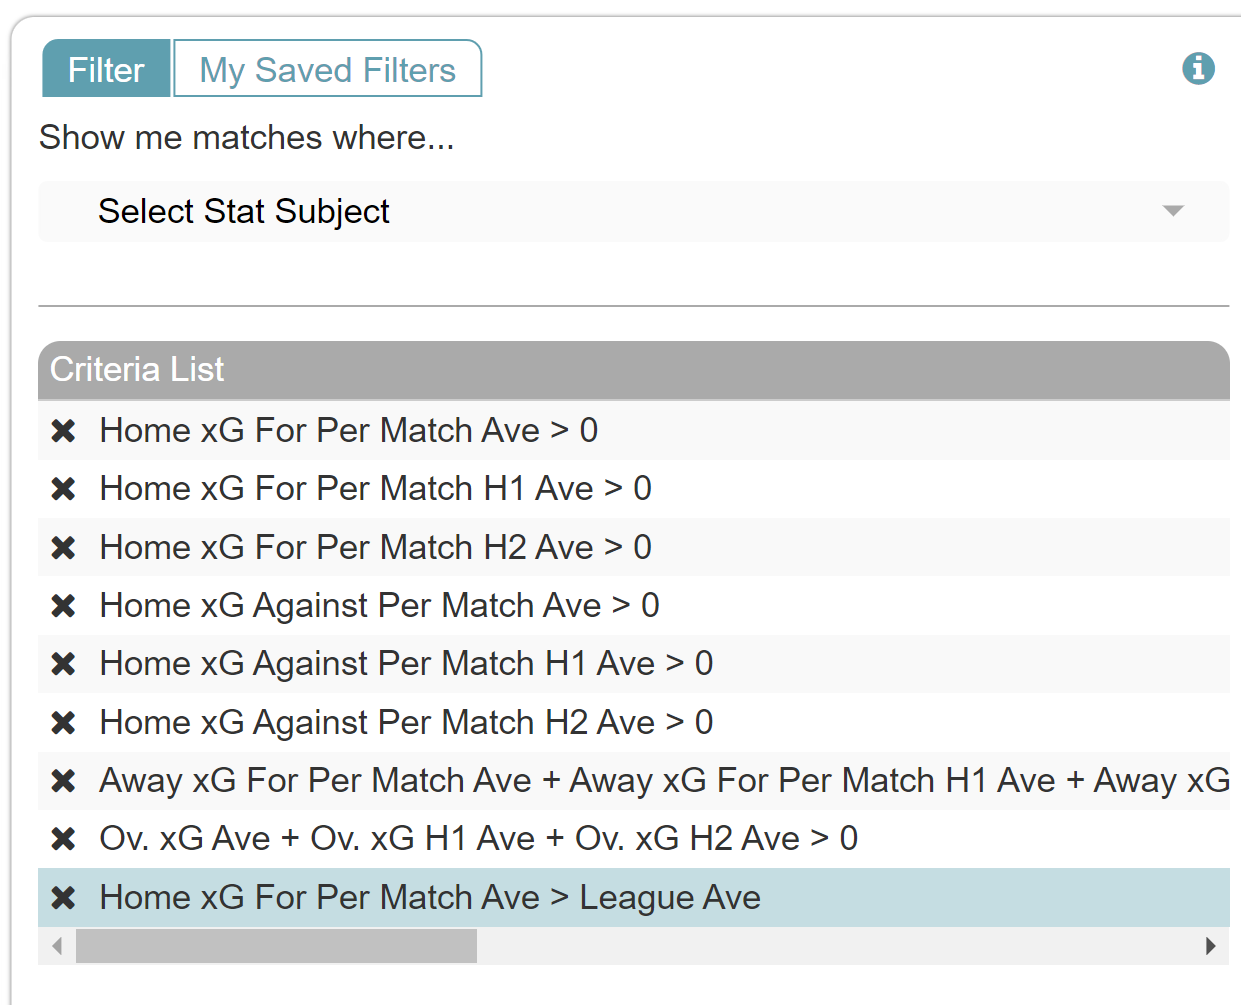
Now xG is going to be for or against and for home or away and overall.
As usual on our software, we’ve also got half time and full time XG stats, which I think is really interesting.
Again, Adam going above and beyond our Betfair Trading software.
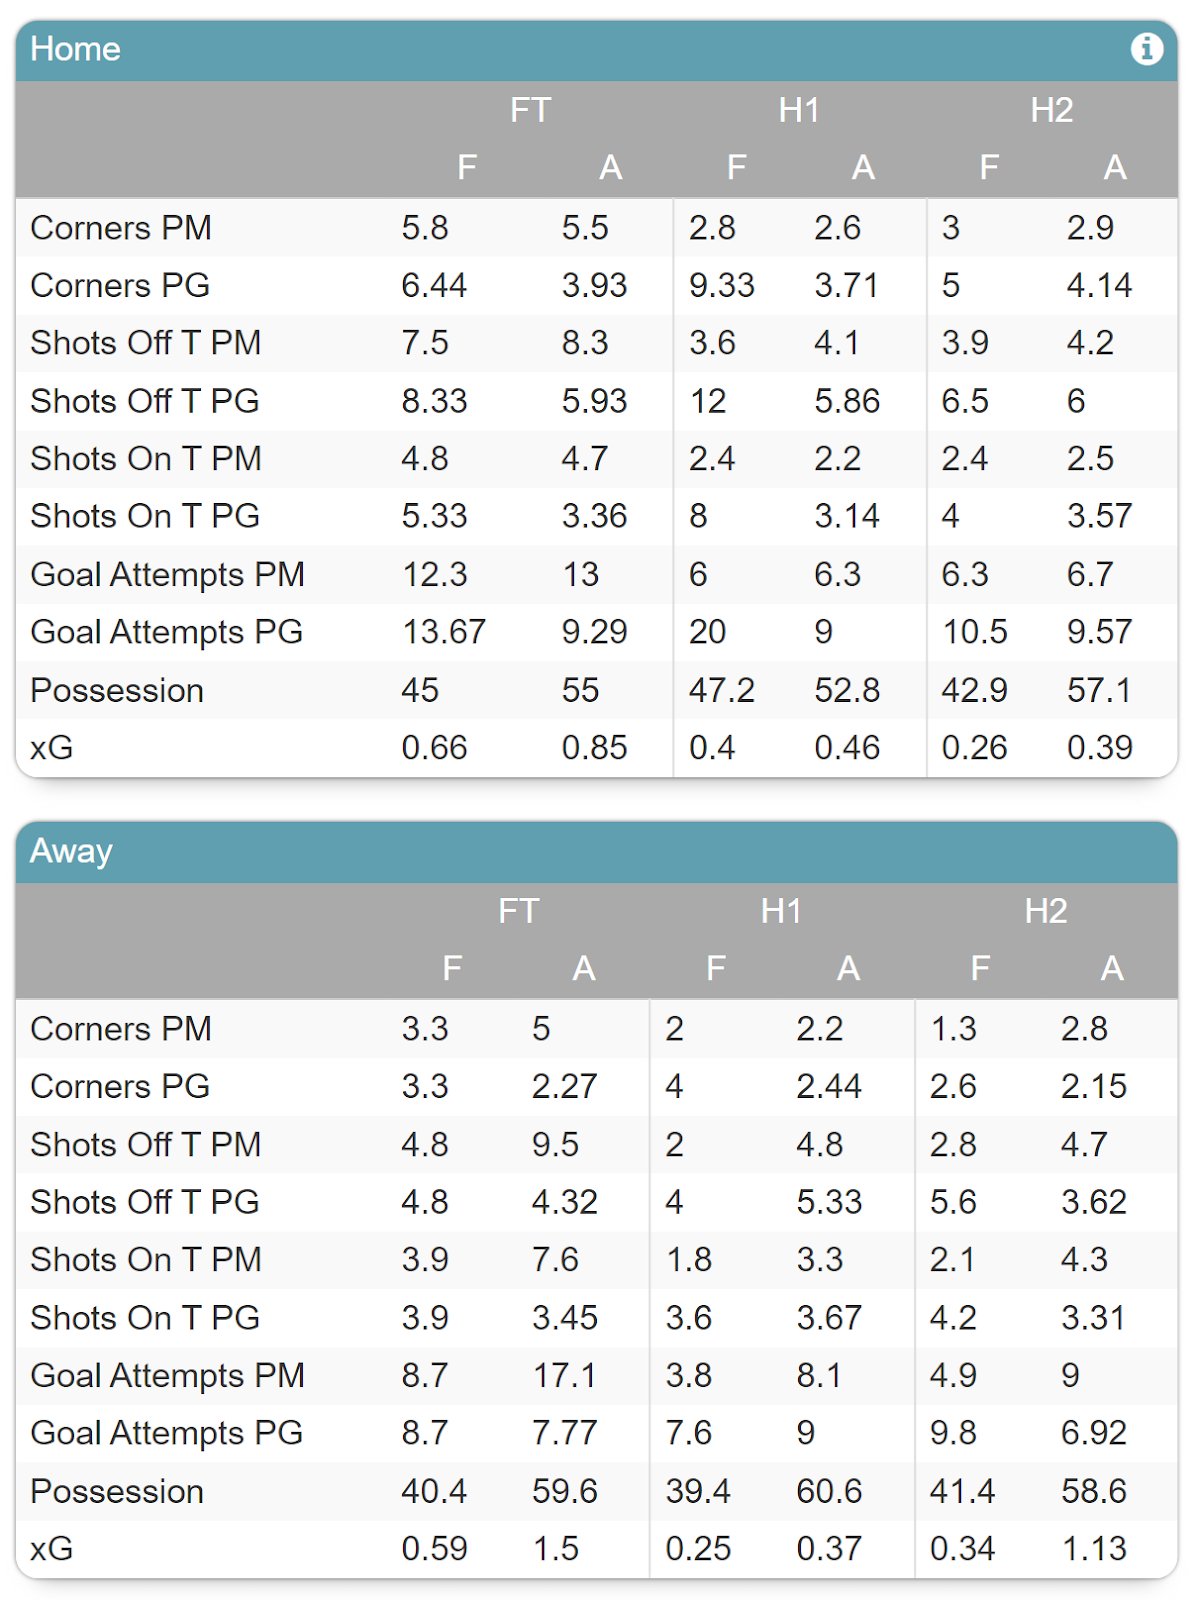
We’ve even got a first half xG stat! So what’s really interesting here is you’ve got the half, first half xG, you’ve got the second half xG individually and you’ve got the full time xG.
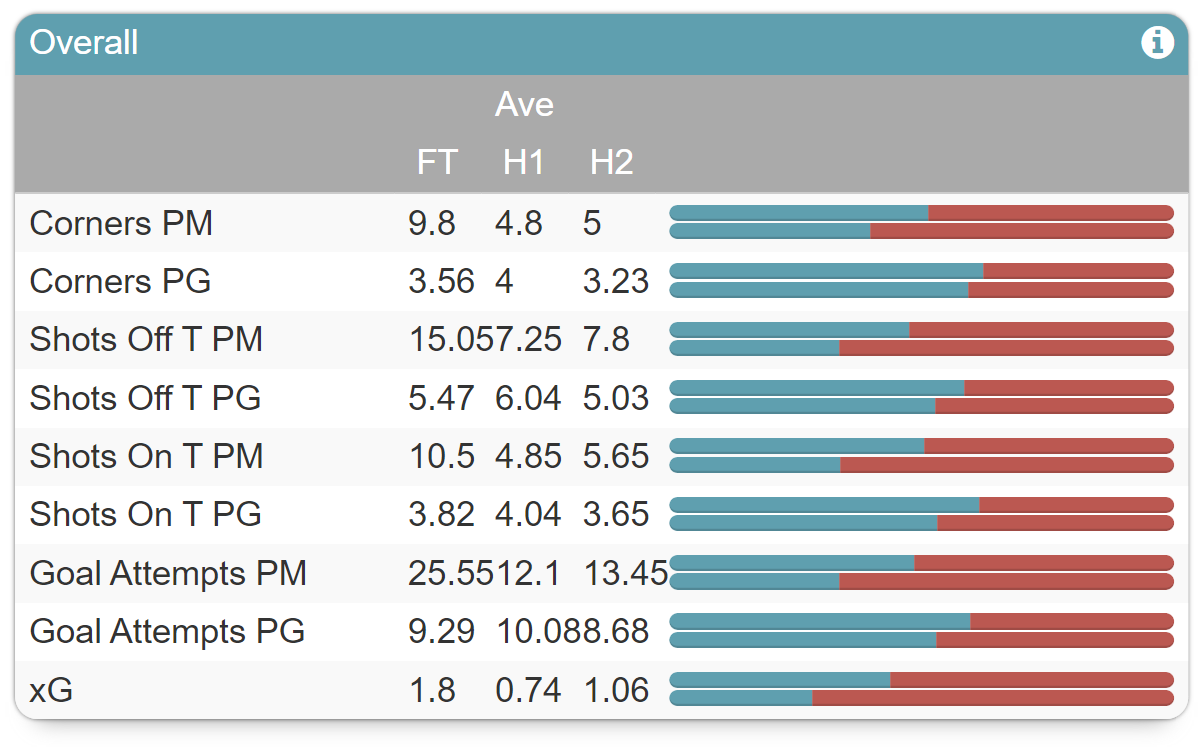
So kind of covering all the bases which, is just phenomenal work from Adam. You can compare to opposition and league country averages.
So you can look at the xG stat and look at the averages of that league and country and see whether they match up.
Is this team a higher scoring team compared to the rest of the league or are they lower scoring?
One little note to make here as well, head to head stats will usually be empty currently because we don’t have enough match history for xG.
So why do I love xG as a stat?
I think that it can help you work out which teams are being overrated or underrated. Due to the oddsmakers looking at how many goals they’ve actually scored rather than looking at the xG.
I mentioned earlier that xG helps remove luck and variance.So, xG is saying if the game was played true to what happened in front of us, this is how many goals should have been scored.
Here is another potential trading angle:
Let’s say Chelsea are playing Arsenal at home. The full-time result is 4-0 but Chelsea’s xG was only 1.2. So, they scored three more goals than they were expected to.
Well, what’s likely to happen is that the bookies are going to look at that and go:
‘Wow, Chelsea scored four goals. They’re a really high scoring team, we had better shorten the over 2.5 goals price.’
However, if you’re a clever trader, you might look at that and go, I’m going to take under 2.5 goals here!
They shouldn’t have scored as many as they did.
They were lucky to get that many goals and thus the bookmakers will now overrate the chance of them scoring goals.
That’s a very simple, quick idea that I’ve just had off the top of my head. Which is something you guys should really practice doing when you’re thinking about creating strategies.
What I would then do is go and test this. I don’t know if that will ring true.
What I do know is that there might be an opportunity there and I will do anything that I can to try and beat the odds makers on Betfair.
And again, I know I labor this point a lot but it’s really crucial to go and test this stuff.
And see, does it work?
Does xG help you?
Is there an angle?
Record some data
So all these kinds of things that you can do are things that you should always be doing when you’re implementing an idea when you’re trying to think of a specific strategy.
I’m really interested to see what you guys come up with because you always surprise me and create amazing strategies!
We really do listen to your feedback and we take it all on board and you wanted xG, so now you’ve got xG!
If you aren’t a member yet it’s time to check out the packages here!
So yeah, again, we just implemented another stat that’s going to change the game.
Imagine adding a filter of xG to a strategy and getting your selections given to you each day by the software. At just a click of a button!
Then being able to place those trades on Betfair!
Pretty incredible, right?
